Episode Transcript
[00:00:00] Hello. Welcome to the money Adjustment. I'm your host, Doctor Mark Kramer, DC. I am a chiropractor who loves investing and trading. Are you interested in what's moving markets and your money? Great. Me too. Let's get started.
[00:00:19] Today is going to be episode one of the money adjustment with me. I wanted to do this podcast for quite some time now, and it's finally evolved to the point where I have streamlined some of my processes to get this out to you in a timely manner. Prior to that, I was doing YouTube videos, which wasn't my intention, but they were the easiest thing to get started. Now I am ready to launch the podcast. I do have an episode, which is an interview episode scheduled for this Friday, September 13, 2024. I was going to make that my first episode, but today I did some live trading and it was a profitable day and kind of a fun one, so I thought, why wait any longer? Let's just get started. Today is episode one of the money adjustment and it is a live trade. Future episodes will have interviews, educational material, and more. Live trading. Listen in, follow, subscribe, do what you do on whatever platform you're seeing this on, and I hope that we can build a relationship together because I really do love trading and I hope that you follow me on this journey and find some value in what we're doing together.
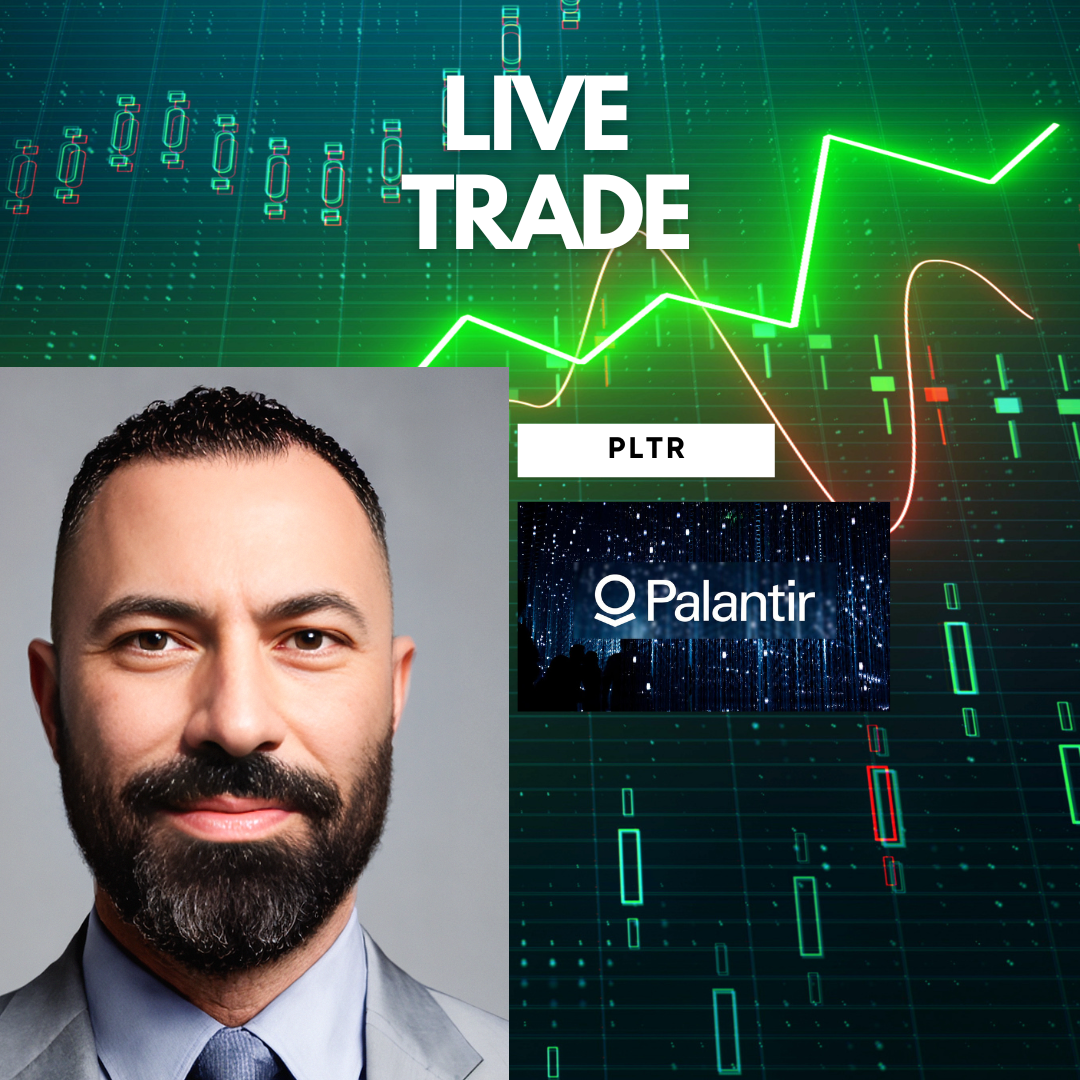
[00:01:43] Monday, September 9, 2024 I was planning on doing some live streaming today, but I've having some technical difficulties with live streaming. So I am just recording this and we'll see if it gets posted. If you're watching it, it got posted. I'm trading the market open and I'm actually interested in trading today because one position that I'm watching is palantir. Actually, hold on, let me share my screen with you guys so you can see what's going on. Now, the platform that I use for trading is webull. And if you see down here in the left hand side, I have a whole list of stocks. This is basically my watch list for August. These are stocks that I've been watching for one reason or another, usually based on some news. You see, we got some big tech in here, like Apple, Nvidia. Nvidia is a big one. It's one of the bigger market leaders this year. So it's one to follow even if you're not trading it. I have unity on here, which has been a terrible stock for me this year. I traded this one very poorly. But I do feel like there is going to be a turn at some point and there's going to be some fast upside. So I keep watching it. Tesla is on here. It's another very actively traded stock. And today I'm really interested in Palantir. I have a long position in Palantir. I would say Palantir is currently my second largest position in my retirement portfolio. And I've been very bullish on the stock as of late. And that bullishness is paid off Friday afternoon, not afternoon, after the close. It gapped up after the close based on news that it's going to be accepted in the s and p 500. So is Dell, but I don't trade dell, I don't follow Dell, but I do follow Palantir, and it's up 8% pre market. So then what I do is I look at the weekly charts. I already have some lines filled in here in terms of where I think the stock can go. These are key levels of either resistance or support depending on where the stock price is trading. So currently the stock price is above a significant level of resistance. So this stock could potentially run quite a bit. I have another level which is less, I should say there wasn't consolidation at this level, but I think it'll be just an interesting level to watch, is the $35 level. So the stock is currently trading at.
[00:04:12] Looks like the pre market high was 33.15.
[00:04:16] And when it gapped up, I mean, it closed at $30.35 and it got up to as high as $33.15 in the pre market. And right now it looks like it's holding the level of 3275, which was a previous level of support. So if it can hold that level on the open, this side could see this stock could see a nice push up to about the dollar 35 level, could also reverse on the open. And the pre market market low, not including the aftermarket on Friday, looks to be about $32. So my guess is maybe it trades a little bit around that 32 level. We'll see. It looks like the MACD is about to reverse. The RSI is right in the middle, so it's not overbought or oversold. And I don't have any volume yet. So those are kind of the things that I look at. Those are indicators that I look at. MACD, RSI and volume. If you are not a trader or a novice, then none of this, none of these words may mean anything to you, but I'm guessing if you're listening to this or watching this, then they do mean something to you. So those are what I look at. MACD, RSI, volume. Mostly I trade off price action support and resistance levels. But I use MACD, RSI and volume for areas of confluence. And confluence basically means areas where there's something's pointing to the same thing. So what I mean by that, if the MACD looks like it's turning bullish and RSI looks like it's favoring the direction I'm doing the trade. Let's say I'm doing a trade long, and if I'm going long, I want to see if it's overbought or oversold. If it's oversold, then I might be more bullish because there's a higher likelihood that it will go, the price action will turn positive, and if it's overbought, it's the opposite. And then volume is a key one because volume lets me know how many people are trading this stock. And institutions really show up here. If they're not in the Blackpool, institutions will create large volume because they buy large amounts of shares. So if I see like an institutional size volume come in, or a lot of people coming into this stock, then I also feel like that will favor the direction I'm trading it today. It's positive news. Palantir being accepted into the s and p 500. So my bias is bullish. My ranges are between $32 and $35. If I can get an entry at around the $32 level, I might take it for a $2 scalp trade, one to $3 scalp trade, depending on the price action and my indicator. So RSI, MACD, volume. If everything's lining up and I and I have a very strong signal, then we would call that an a plus setup. The market's trending positively. The stocks trading on positive news indicators are favoring a trend change. So all of those would make me feel actually very bullish. In which case I like to go long, which means I like to bet that a price of a stock is going to go up and not go down. If all of those things line up, then I want to maybe take a larger position size than I normally would because I'm more confident in the trade. Still need a stop loss. If I'm thinking the $32 level, depending on what my entry is, I would stop loss at the market low, which is 32 ten. So if I get an entry level in the somewhere between 32 50 in that range, with a 40 cent downside and potential one to $2 upside. So that's a good, good risk reward ratio for me. Let's assume it was 50 cent downside, $1 upside. That would be a one to two risk reward. Which is a nice risk reward ratio. So currently it's 929 stocks about to move. We'll see. It's either going to gap up or gap down. Right now it's favoring down. If I can get into this could be a sell the news. So my bias could be completely wrong. I may need to change my bias based on the price action. So the volume's in there, it's getting pushed down. It's going to the downside. It's a $30 stock, so I usually buy about 500 shares of those. I'm looking at, like I said, a price entry of, let's say, 32 if it goes into that level. Also, I'm trading the two minute. The 1 minute is a little bit messier, and the two minute, it gives you a little cleaner signal for a scalp trade. Now, it already looks like there's buyers down there in that 32 level. So our first candlestick is going to close at the, our first two minute candlestick looks like it is range bound currently between 32.47 and 32.76. And it's already going to the upside. There's definitely buyers in there. I do would like to see if I can get a better entry for a better risk reward ratio. The stock might take away, get away from me. Which it looks like it's already starting to move, in which case, if you miss a trade, you miss a trade. That's just how it works. I can look for another entry above that level. I want to see what the stock is trending before I jump in because I've just been burned too many times on the open. It already looks like it's starting to move. It's favoring the upside. It's already pushing towards the upper level. You'll see where the candlestick closes. So I'm not going to, I'm not going to jump into this trade for at least four minutes. So I want to see two candlesticks. That'll give me a sense of direction. And if the trend is positive, then I'll look for a pullback entry. And if the trend is negative, I'll probably still look for an entry long at a lower level.
[00:10:08] First candlestick, it looks like it's going to close here at 3285. It's already starting to go up. Yeah, it's going up. It wants, the stock wants to run. So if it breaks that 30, it already broke. Let's, let's see. I might change my price target now to 33 and then stop loss just below that. I don't even think I'm going to get that 33, but we can see. All right, let's see if it's coming in. I placed an order for $33. You can see my order comes up here, 500. I would do a stop loss at 32.85. So I'm looking at a 15 cent downside. If I even get filled, this stock looks like it's going to take and run. So if it hits my price target before I get a chance to get an entry and it's over, I'm like, I just didn't. I missed the trade, which is fine. There we go. All right, so, like, it looks like I'm filled. I'm filled at the $500 level to watch that. 3285. So I'm just going to put a 32.85 in here for a sell in case I need to click that button quick. But it looks like it's just going up right now. I'm $60.33, $60 positive. I still feel pretty good. Long.
[00:11:16] Yeah, actually. Okay, so the volume candles. There are two candles so far. They're both above the average volume. So this average volume is on my chart right now, this blue line. And so if it's trading above its average volume, it just shows me there's a lot of interest in the stock right now. So right now, I'm 100, $2130 positive. It's 33, 25. I may even raise my stop loss, because at this point, I don't want to lose any money. I don't want to see it come back in on me. I don't want to have a winning trade turn into a losing trade.
[00:11:53] So let's see, I'll make this a little bit bigger so we can see what's going on. So it's still. It's pushing towards it already got to above its pre market high very quickly, so that's pretty bullish. And again, I'm looking for a scalp trade. I'm going to, but I just want to make a couple hundred bucks on this thing and then get out, and it looks like it's probably going to happen for me. So my entry was 33, and we're going to get to actually, what was my entry? Yeah, 33 on 500 shares. Now we're at 33, 36. If I get to 3350, that's going to be $250 in about five minutes. So that's what we're looking at here.
[00:12:32] And it's running. It's running. It looks very bullish.
[00:12:38] I do feel like it's probably going to. It could hit that $34 level. I'm feeling very bullish. My indicators are bullish. We're still RSI. We're not bad. We're not overbought yet. And I think if it hits. Yeah, it's already starting to come back in. It's already starting to come back in. So maybe I'll lock that 200 in so hard. This is where it gets hard. So I take my profits at 250. It's a pretty good day. $250 in less than four minutes is a nice chunk of change, but it looks like it's still running. And we're running. Let's see what's happening here. I don't know why I'm not seeing how much time is left. 29 seconds. So we'll see where the second candle closes. It's so far looking very bullish for Palantir today on the open. I don't know where it'll close. I don't know where it'll wind up. Intraday. I think I'd like to make $300. $300 would be a nice move, actually, 500, right. If I trade it to $34, which I think it could hit, I'm going to check in with my boys here because. Okay, so I watched CNBC. They're talking about Nvidia. And I also watch Trader TV live. It looks like they're trading Palantir also. So that's fun. We're in the same trade here. Looks like Sean was in at 33. Well, now they got this cash sweep. They got an advertisement covering, so I can't see their position.
[00:14:02] There it is. They're in at Palantir. Neil's in at Palantir at 33.15.
[00:14:08] Sean is in at 3313. I'm in at 33. So I'm at a better entry. Ooh, that was a nasty candle that just showed up there. Real nasty.
[00:14:17] Maybe a little too nasty for my liking. Could trade back into VWAP. Bummer. Okay, so now I'm watching dollar 200 go to dollar 100. Let's see if I do 32. I just don't want to get out of this one. I just feel like it's going higher. There's so much bullish. No, it looks like it's starting to reverse a little.
[00:14:34] Let's see, 3308. I might, just might just close it out. My stop loss at $33 because it's already starting to come in. It's bumming me out. Okay, so let's. There's still buyers. There's still buyers there at that 33 25 level, it's just like, showing a little bit of a signs of a trend reversal. There's a little bit of volume in the other direction, which I don't like. We're getting. We're not oversold. I'm sorry. We're not overbought yet, so that's still favoring bullishness.
[00:15:07] MACD looks like it's still in the upward trending direction.
[00:15:12] This just really, really had a nasty candle there. It was what they call a falling star, which is like the reverse of a hammer.
[00:15:24] Okay, so we're going back up. We're going back up. If we could break that 3354, this is going to be, this is going to be really juicy. So let's see. It looks like.
[00:15:38] Looks like Neil and Sean are still long in palantir, Neil's position. His only position long is palantir, and Sean is only two positions or Palantir in Tesla.
[00:15:51] All right. Oh, here we go. We're breaking out. Breaking out above that last candle. Oh, man, that looks.
[00:15:57] Oh, it looks so good right now. Just would really like to see that 34 ish level. Love to make $500. Took me a little bit longer. Be by, like, $500 in ten minutes. That's how day trading works. Can be pretty excitIng, especially when it works in Your direction. It's very joyous, and when it goes against you, it's a lot of pain. So pleasure and pain.
[00:16:22] 3360. I am currently $280 up on the trade. Unrealized. I haven't taken any profits yet.
[00:16:32] I don't know if I want to leg out of this. It's kind of struggling a little bit, but what's keeping me still confident is the volume. The average volume is still favorable to the upside. So it looks like if I see a flush or some type of capitulation, that would make me more anxious, but it looks like it wants to run. I think it really, I don't think there's a lot of resistance, at least until that 34 level. So if I really wanted to kind of make sure I lock it in, I might get out at around 33, 90, because everybody's going to be. Other people trading this are going to be eyeing that $34 level. So there could be a nice pushback at that level. But right now, it's still going up. Still going up. I don't know if I really want to play it safe. I could get out at 350. All right, it's already at 360. I'm still in the trade.
[00:17:26] Volume is still favoring bullishness because the volume got lighter. So the first two bars are very heavy, meaning a lot of people bought in and they haven't sold yet because I haven't seen that amount of volume come out of the stock yet. So here we go. I don't know, I'm feeling a little bit antsy. I think it will go higher. I probably should stay past 34, make more money, but it's hard not to lock in a dollar 490 profit if I can get it. So it looks like I'm probably going to get it here.
[00:17:59] Trying to get it. Why isn't it not showing me? Okay, buy, sell.
[00:18:05] So it's at 500. Perfect. And then I could just sell at 390.
[00:18:12] Sell it. 390. Sell it. 390. It's pushing back. It's pushing back. Oh, man. Let's see, 3080. Dammit. So now I'm already, it's coming back in. Oh, it's just so strong. The volume is just really favoring the upside. It'll probably could trace back into about that 33, 50 level. If it comes back, I'm going to lock in the $400. I feel good. $400 is a nice, nice move. So what is my $400? That's the 3280. Maybe like if I stop loss, that will, that will be like a stop loss.
[00:18:47] Or I could just sell it. I'm just going to sell it. 32. I want to get at least 3280.
[00:18:53] So I don't want to stop loss. This though. I don't know. I don't understand that. Let's just sell it. 3280.
[00:19:01] Come on. 3280. And it closed. Yeah, I feel it could completely close out. So that is day trading in a nutshell. I just made.
[00:19:10] What did I make? Let's take a look at the. Let's take a look. Okay. It won't show me. I got to enter my password. We'll cancel that out of. But if we just go back.
[00:19:20] So I made $400 on this trade from market open 930. So in eleven minutes, $400. And that's why people day trade, and it's very risky. Today was profitable, so I'm happy. I'm going to be. I'm done for the day. $400.10 minutes moment. And I hope you guys enjoy. I'm going to try to do more of these. I'd like to do these live because I think it would be more interesting live and then I won't have to edit it.
[00:19:49] Yeah, so that was the trade. Stay healthy, stay wealthy. Love you guys. Thanks for, thanks for anybody who's watching this because I hope you see I really enjoy technical analysis and trading. I'm not usually a day trader. I'm more of a swing trader, but I had a very strong feeling today and it was correct. And I took a nice little swing at it and pocketed a little bit of money. And now I'm going to go do my, my day job. So we'll see ya. Bye. Thank you for watching this episode of the Money Adjustment. If you want more, like comment and subscribe, you can follow me on X Kramer. Until the next episode, stay healthy and wealthy.